Medication Physician Insights
📌 Introduction
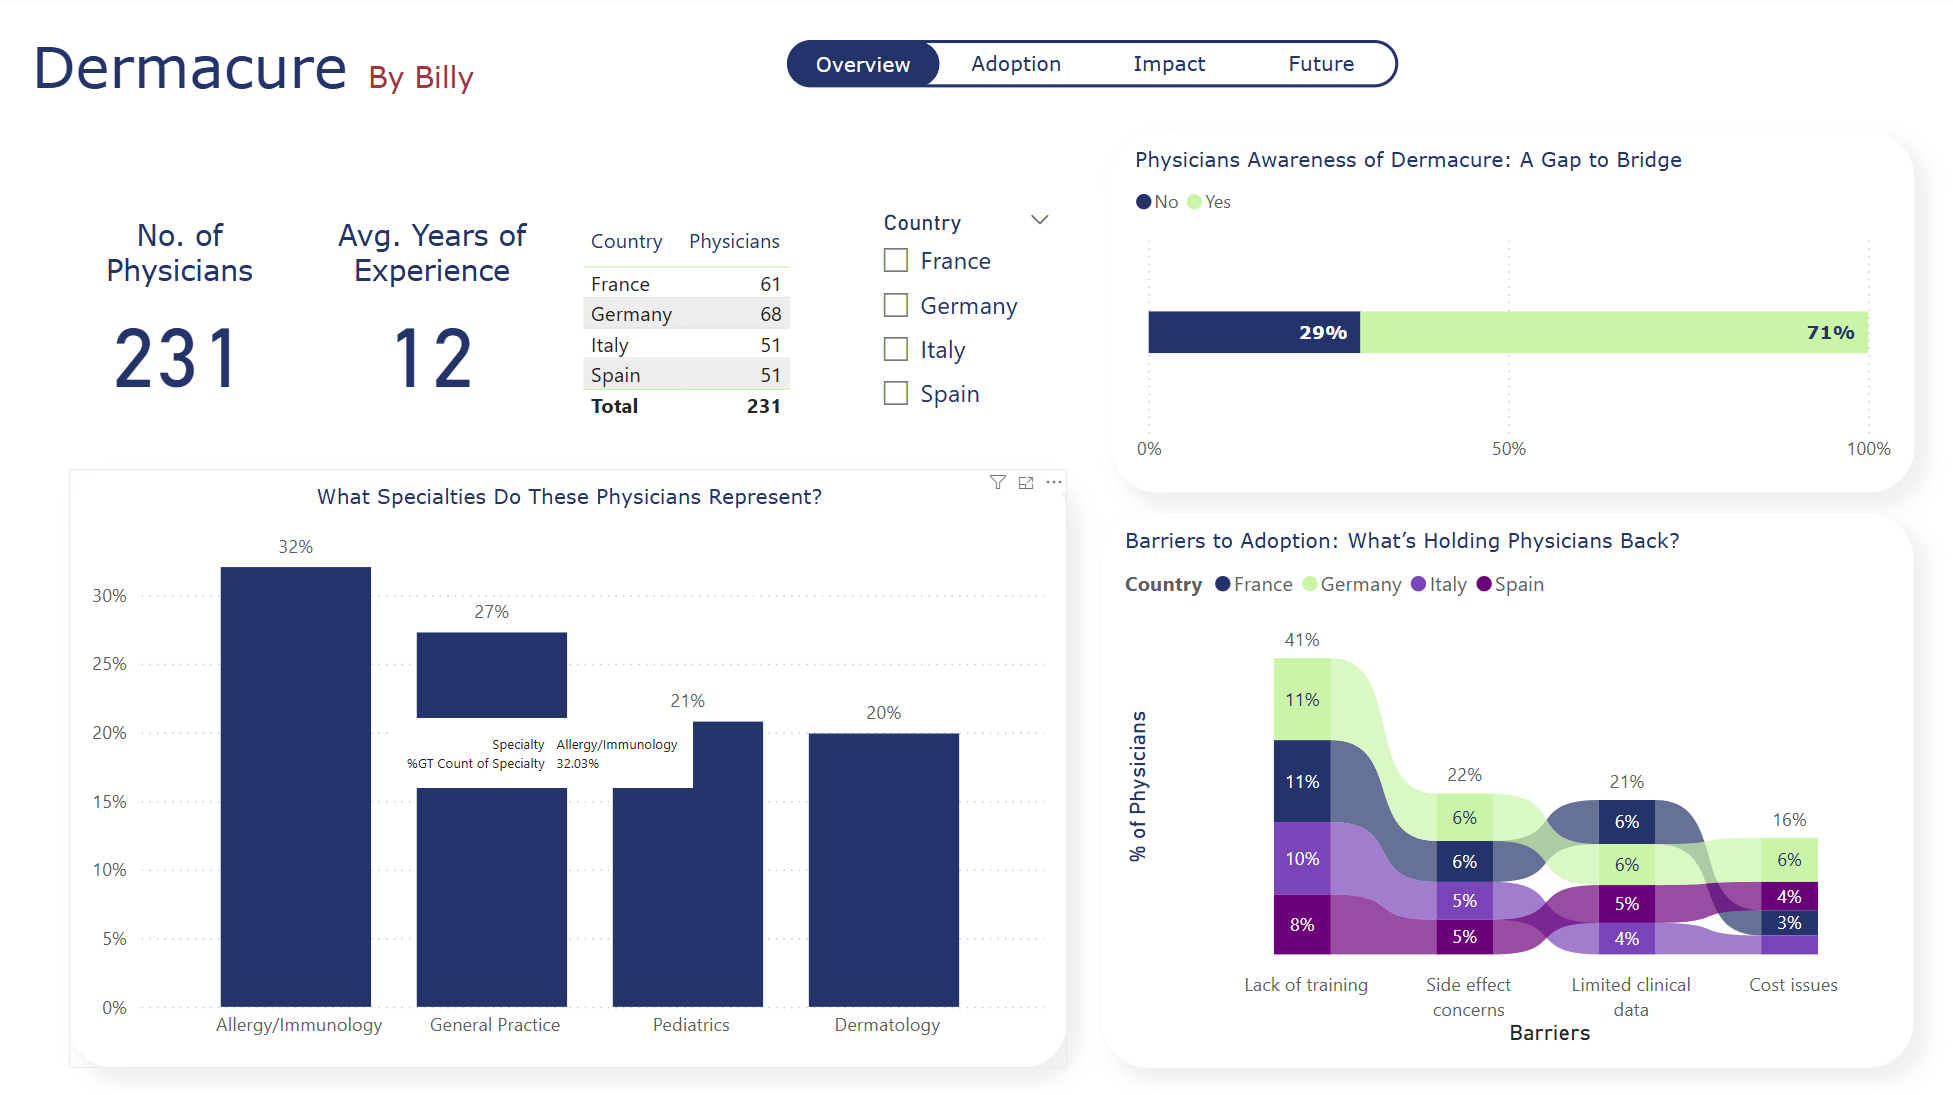
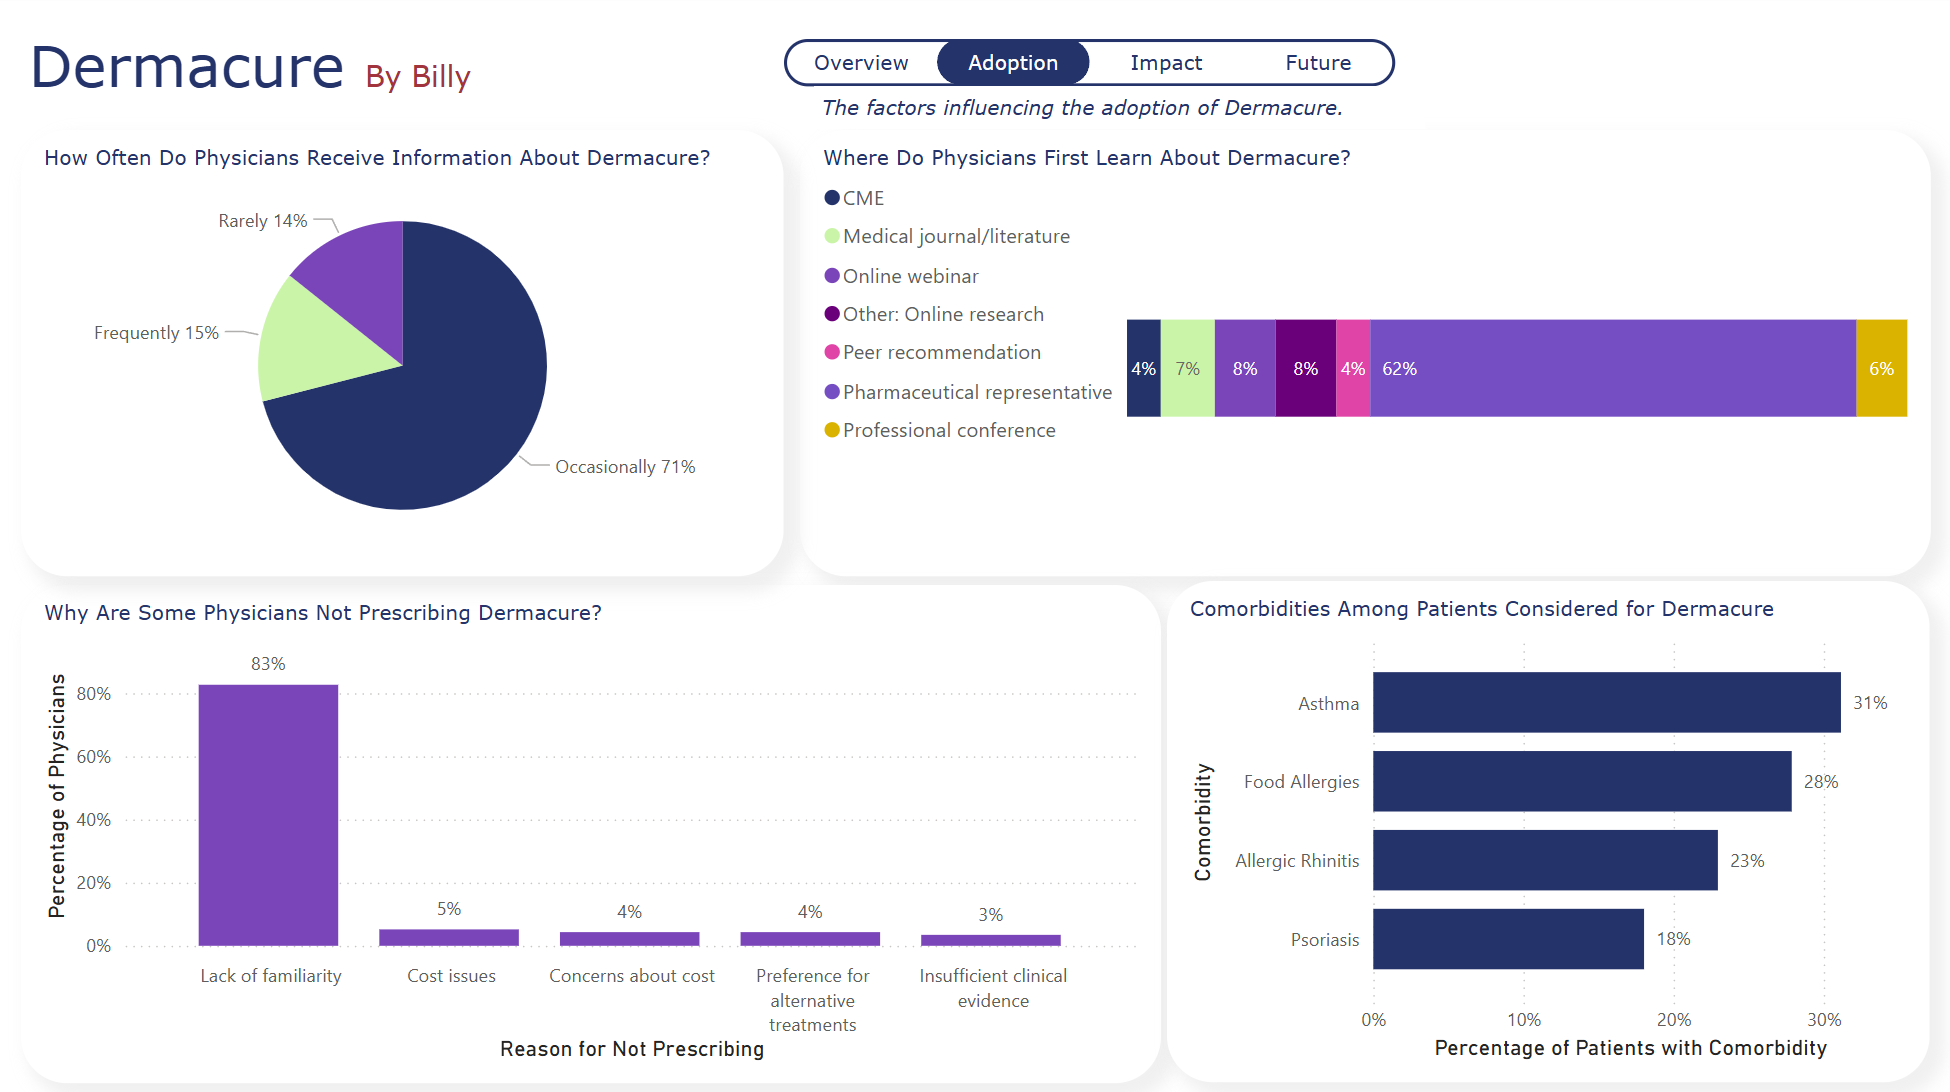
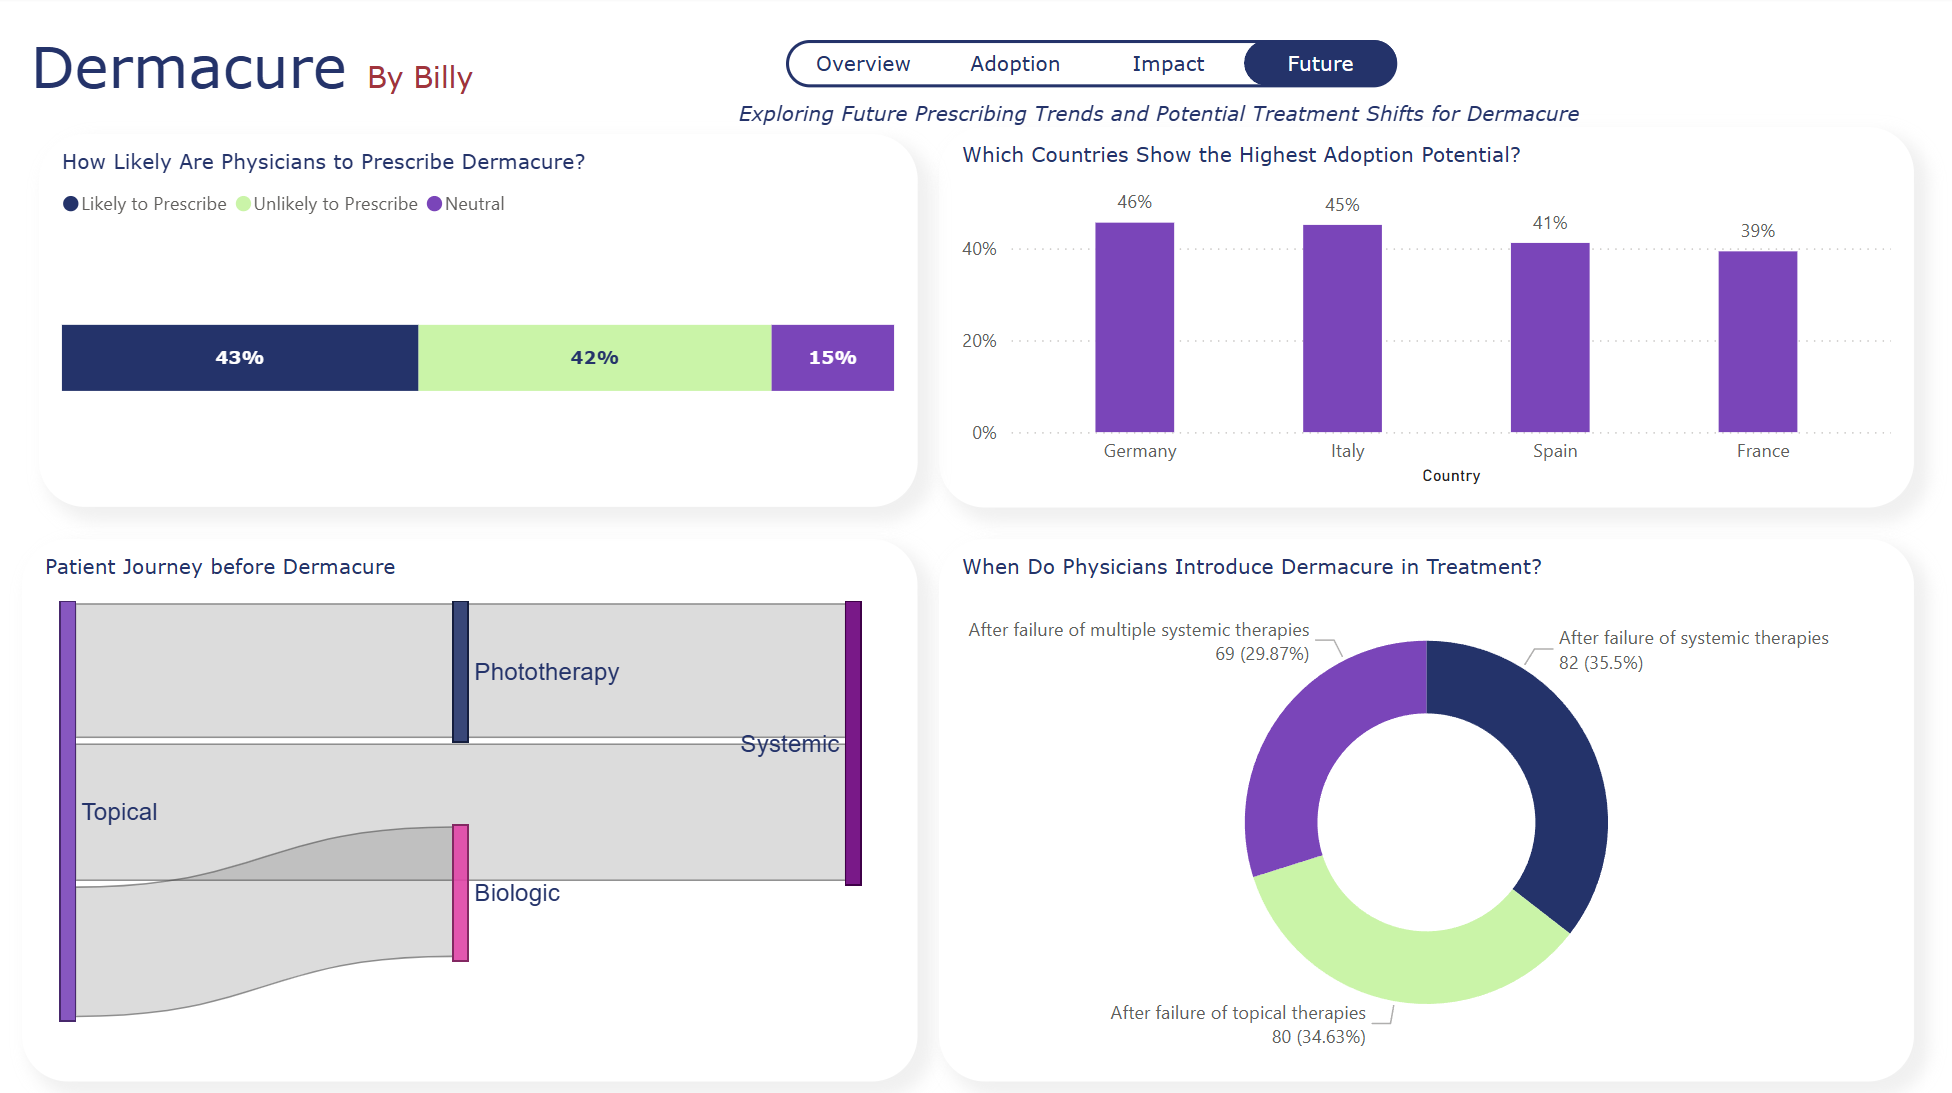
This project is a self-initiated practice to demonstrate data visualization skills using Power BI and Python. The dataset consists of fictional survey responses from 240 physicians across Germany, France, Italy, and Spain, analyzing their awareness and prescribing behavior regarding a fictional medication, Dermacure.
🎯 Objective
- Analyze physician awareness and prescribing trends for Dermacure.
- Identify barriers preventing prescription and understand market positioning.
- Compare Dermacure with alternative treatments like Dupilumab and Upadacitinib.
- Use Power BI to create an interactive dashboard for insights.
📊 Dataset
The dataset simulates real-world pharmaceutical survey data and contains fields such as:
- Specialty: Dermatology, Pediatrics, etc.
- Prescribed_Dermacure: Yes/No
- Number_of_Patients: Patients who received Dermacure
- Overall_Effectiveness: Physician rating
- Future_Prescribing_Intent: Likelihood of prescribing Dermacure
🛠 Solution Approach
🔍 Data Cleaning & Exploration (Python - Pandas)
Using Python with Pandas, I performed thorough data cleaning to ensure accuracy and consistency:
- Identified missing and inconsistent values.
- Removed logical contradictions (e.g., prescribing "No" but entering patient data).
- Standardized categorical data.
📊 Power BI Dashboard
I created a comprehensive multi-page dashboard to visualize the data:
- Visualized physician trends, competitor analysis, and barriers.
- Created interactive filters to segment by country, specialty, and experience.
- Built comparative visualizations to benchmark Dermacure against competitors.

⚡ Skills Demonstrated
Data Preparation
- Data Cleaning & Preprocessing (Python, Pandas)
- Exploratory Data Analysis (EDA)
- Data Quality Assessment
- Statistical Analysis
Visualization & Modeling
- Data Modeling & Transformation (Power BI, Power Query)
- Interactive Dashboards & Visualizations
- DAX Measures & Calculations
- Comparative Analysis
Domain Expertise
- Pharmaceutical Market Understanding
- Storytelling with Data (Life Sciences & Pharma)
- KPI Development for Healthcare
- Prescribing Behavior Analysis
🛠 Technology Stack
- Python (Pandas, NumPy) - Data Cleaning & EDA
- Power BI (DAX, Power Query) - Visualization & Analysis
- Jupyter Notebook - Exploratory Analysis